2.1.33 #
解答 #
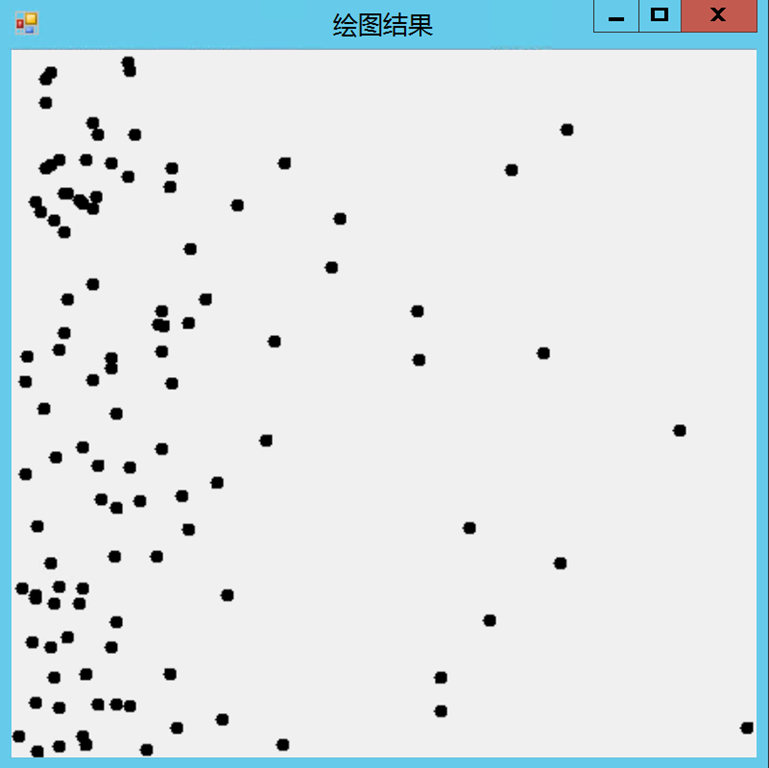
这里每次结果的 Y 轴位置都是随机生成的,这样图像会好看点。
X 轴代表消耗的时间。
选择排序:
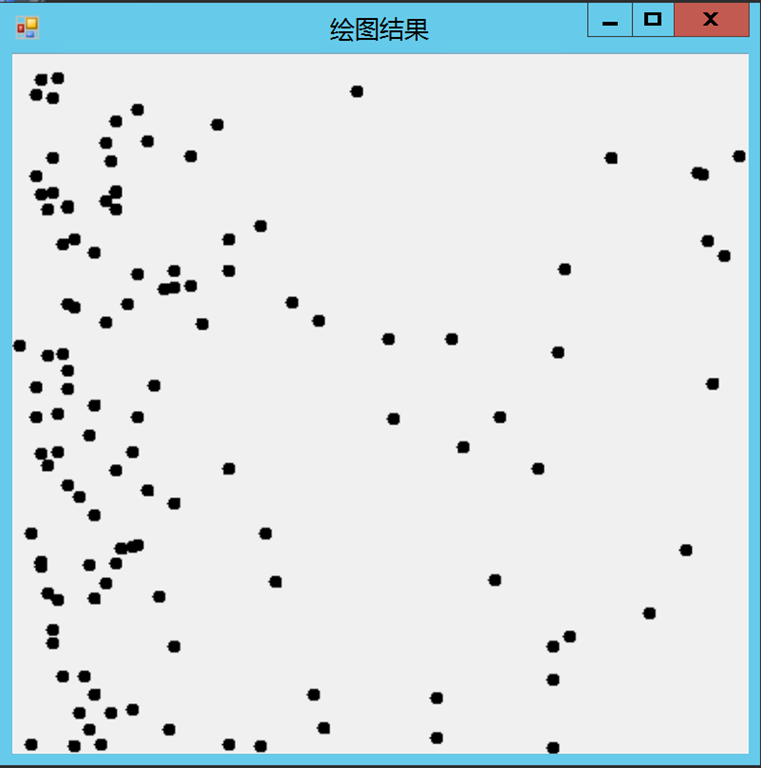
插入排序:
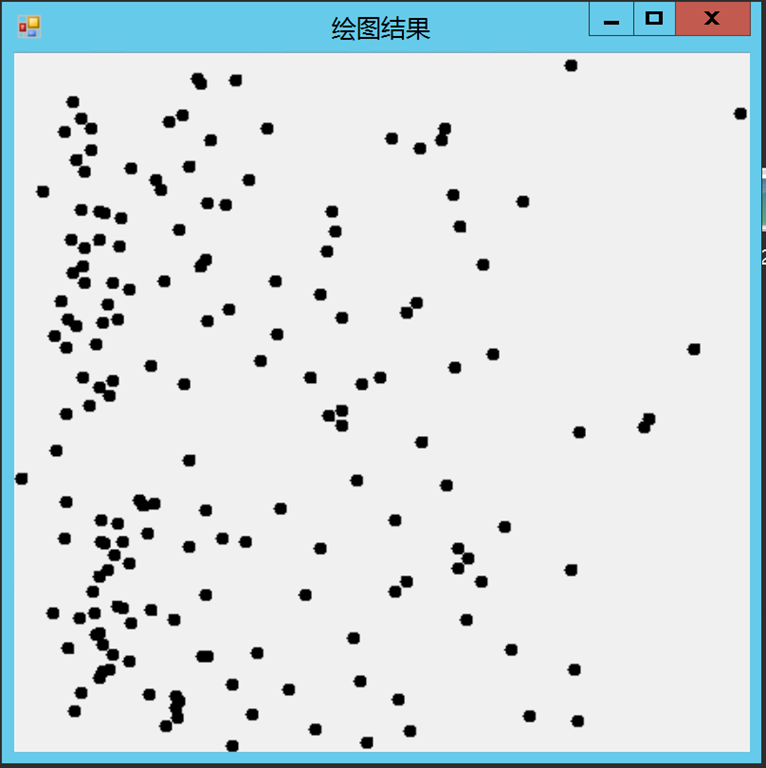
希尔排序:
代码 #
using System;
using System.Collections.Generic;
using System.Drawing;
using System.Linq;
using System.Windows.Forms;
using Sort;

namespace _2._1._33
{
    public partial class Form2 : Form
    {
        List<double> resultList;
        List<float> resultYList;
        Rectangle clientRect;
        Rectangle drawRect;

        BaseSort sort;
        int n;

        /// <summary>
        /// 构造一个绘制结果窗口。
        /// </summary>
        /// <param name="sort">用于测试的排序算法。</param>
        /// <param name="n">测试算法是生成的数据量。</param>
        public Form2(BaseSort sort, int n)
        {
            InitializeComponent();
            this.resultList = new List<double>();
            this.resultYList = new List<float>();
            this.clientRect = this.ClientRectangle;
            this.drawRect = new Rectangle(this.clientRect.X + 10, this.clientRect.Y + 10, this.clientRect.Width - 10, this.clientRect.Height - 10);
            this.sort = sort;
            this.n = n;
            this.timer1.Interval = 500;
            this.timer1.Start();
        }

        /// <summary>
        /// 执行一次测试并绘制图像。
        /// </summary>
        public void Test()
        {
            Random random = new Random();
            double[] array = SortCompare.GetRandomArrayDouble(this.n);
            double time = SortCompare.Time(this.sort, array);
            this.resultList.Add(time);
            this.resultYList.Add((float)(random.NextDouble() * this.drawRect.Height));
            DrawPanel(this.resultList.ToArray(), this.resultYList.ToArray());
        }

        /// <summary>
        /// 根据已有的数据绘制图像。
        /// </summary>
        /// <param name="result">耗时数据(X 轴)</param>
        /// <param name="resultY">Y 轴数据</param>
        public void DrawPanel(double[] result, float[] resultY)
        {
            Graphics graphics = this.CreateGraphics();
            graphics.Clear(this.BackColor);
            graphics.TranslateTransform(0, this.ClientRectangle.Height);
            graphics.ScaleTransform(1, -1);

            PointF[] dataPoints = new PointF[result.Length];
            float unitX = (float)(this.drawRect.Width / (result.Max() - result.Min()));
            double min = result.Min();
            SizeF pointSize = new SizeF(8, 8);
            for (int i = 0; i < result.Length; i++)
            {
                dataPoints[i] = new PointF((float)(unitX * (result[i] - min)), resultY[i]);
                graphics.FillEllipse(Brushes.Black, new RectangleF(dataPoints[i], pointSize));
            }
        }

        private void timer1_Tick(object sender, EventArgs e)
        {
            Test();
        }
    }
}